States Economic Rankings
Page 1 of 1
 States Economic Rankings
These Maps Tell The Story Of America's Boom, Bust, and SLOW Comeback

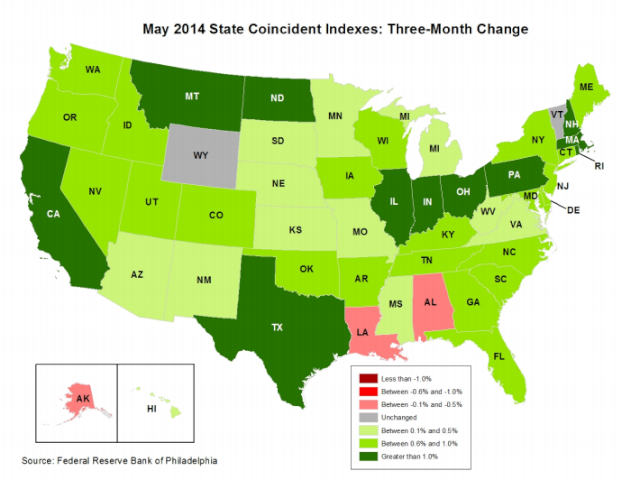
This map shows most U.S. states are growing, though still somewhat feebly.
Just 10 states, mostly concentrated in the Midwest and oil-rich regions, saw growth in the indices above 1% in Q1
Everyone else is just kind of inching along.
The coincident indexes combine different state-level indicators to give us a picture of current economic conditions for that state.
Anyway, the latest readings could be way worse — and we have the history to show it. Every month, the Philly Fed publishes a colour-coded map tracking economic activity across the country. Red shows economic contraction while blue or green show expansion.

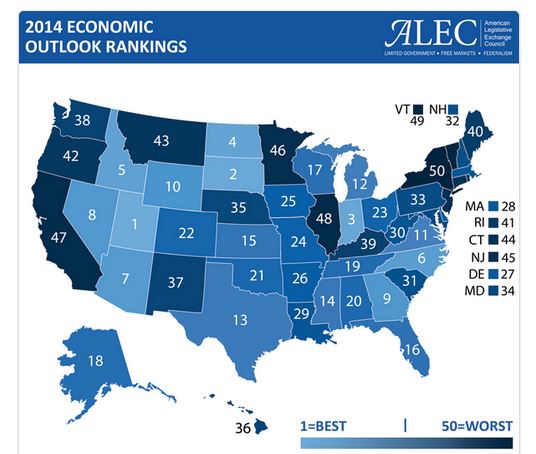
The lower the number on the map the better the economic ranking (healthier economy)
Texas dipped one spot to No. 13 this year in economic outlook competitiveness as changes in other states improved their rankings, according to new data from the American Legislative Exchange Council, a group of conservative state legislators.
The forward-looking ranking aims to identify policies that can help states achieve greater economic prosperity based on 15 policy measures, including tax rates and labor policies.
Based on those measures, Utah was No. 1 and New York was No. 50.
“The big story in our report this year is that fundamental tax and fiscal policy reforms significantly improved the economic competitiveness rankings of North Carolina [No. 6], Indiana [No. 3] and Michigan [No. 12],” said Jonathan Williams, director of the American Legislative Exchange Council’s Center for State Fiscal Reform and co-author of the report.
“The evidence is clear: Economic prosperity is attainable for those states that exercise discretion and discipline in spending and taxation,” Texas Gov. Rick Perry told ALEC. “Pro-growth tax and fiscal policies … set a clear path to a renewed national economic recovery.”
A list showing how the 50 states and Washington D.C. stack up in job creation between June 2009 and June 2014, ranked from fastest to slowest growth in hiring. You also need to look at each states population to see if it created a meaningful difference.
Top states
State / Jobs created in June 2009 / Jobs created in June 2014 / Percentage change
North Dakota 367,000 465,000 +26.6 percent
Texas 10.28 million 11.55 million +12.3 percent
Utah 1.19 million 1.33 million +12.3 percent
Colorado 2.24 million 2.45 million +9.2 percent
Florida 7.22 million 7.80 million +8.0 percent
Michigan 3.84 million 4.14 million +7.9 percent
Indiana 2.78 million 2.99 million +7.8 percent
Tennessee 2.61 million 2.80 million +7.4 percent
South Carolina 1.81 million 1.933 million +7.1 percent
Oregon 1.61 million 1.72 million +6.7 percent
Washington 2.86 million 3.05 million +6.7 percent
Nevada 1.14 million 1.22 million +6.7 percent
Minnesota 2.65 million 2.82 million +6.6 percent
Oklahoma 1.57 million 1.67 million +6.4 percent
Montana 429,000 455,000 +5.9 percent
Idaho 609,000 645,000 +5.9 percent
North Carolina 3.90 million 4.12 million +5.7 percent
Arizona 2.43 million 2.55 million +5.2 percent
Ohio 5.04 million 5.31 million +5.2 percent
Delaware 416,000 438,000 +5.2 percent
Kentucky 1.76 million 1.85 million +5.1 percent
Georgia 3.90 million 4.10 million +5.1 percent
Iowa 1.48 million 1.55 million +5.0 percent
Hawaii 593,000 622,000 +4.9 percent
Wisconsin 2.74 million 2.86 million +4.4 percent
USA130.94 million138.78 million+6.0 percent
Copyright 2014 The Associated Press. All rights reserved.

This map shows most U.S. states are growing, though still somewhat feebly.
Just 10 states, mostly concentrated in the Midwest and oil-rich regions, saw growth in the indices above 1% in Q1
Everyone else is just kind of inching along.
The coincident indexes combine different state-level indicators to give us a picture of current economic conditions for that state.
Anyway, the latest readings could be way worse — and we have the history to show it. Every month, the Philly Fed publishes a colour-coded map tracking economic activity across the country. Red shows economic contraction while blue or green show expansion.

The lower the number on the map the better the economic ranking (healthier economy)
Texas dipped one spot to No. 13 this year in economic outlook competitiveness as changes in other states improved their rankings, according to new data from the American Legislative Exchange Council, a group of conservative state legislators.
The forward-looking ranking aims to identify policies that can help states achieve greater economic prosperity based on 15 policy measures, including tax rates and labor policies.
Based on those measures, Utah was No. 1 and New York was No. 50.
“The big story in our report this year is that fundamental tax and fiscal policy reforms significantly improved the economic competitiveness rankings of North Carolina [No. 6], Indiana [No. 3] and Michigan [No. 12],” said Jonathan Williams, director of the American Legislative Exchange Council’s Center for State Fiscal Reform and co-author of the report.
“The evidence is clear: Economic prosperity is attainable for those states that exercise discretion and discipline in spending and taxation,” Texas Gov. Rick Perry told ALEC. “Pro-growth tax and fiscal policies … set a clear path to a renewed national economic recovery.”
A list showing how the 50 states and Washington D.C. stack up in job creation between June 2009 and June 2014, ranked from fastest to slowest growth in hiring. You also need to look at each states population to see if it created a meaningful difference.
Top states
State / Jobs created in June 2009 / Jobs created in June 2014 / Percentage change
North Dakota 367,000 465,000 +26.6 percent
Texas 10.28 million 11.55 million +12.3 percent
Utah 1.19 million 1.33 million +12.3 percent
Colorado 2.24 million 2.45 million +9.2 percent
Florida 7.22 million 7.80 million +8.0 percent
Michigan 3.84 million 4.14 million +7.9 percent
Indiana 2.78 million 2.99 million +7.8 percent
Tennessee 2.61 million 2.80 million +7.4 percent
South Carolina 1.81 million 1.933 million +7.1 percent
Oregon 1.61 million 1.72 million +6.7 percent
Washington 2.86 million 3.05 million +6.7 percent
Nevada 1.14 million 1.22 million +6.7 percent
Minnesota 2.65 million 2.82 million +6.6 percent
Oklahoma 1.57 million 1.67 million +6.4 percent
Montana 429,000 455,000 +5.9 percent
Idaho 609,000 645,000 +5.9 percent
North Carolina 3.90 million 4.12 million +5.7 percent
Arizona 2.43 million 2.55 million +5.2 percent
Ohio 5.04 million 5.31 million +5.2 percent
Delaware 416,000 438,000 +5.2 percent
Kentucky 1.76 million 1.85 million +5.1 percent
Georgia 3.90 million 4.10 million +5.1 percent
Iowa 1.48 million 1.55 million +5.0 percent
Hawaii 593,000 622,000 +4.9 percent
Wisconsin 2.74 million 2.86 million +4.4 percent
USA130.94 million138.78 million+6.0 percent
Copyright 2014 The Associated Press. All rights reserved.

ezine- Posts : 2
Join date : 2014-07-17
Location : SE Georgia, USA
Page 1 of 1
Permissions in this forum:
You cannot reply to topics in this forum
