
Choosing A Good State To Live MAPS
Page 1 of 1

Choosing A Good State To Live MAPS
![]() by Sun May 12, 2013 7:38 am
by Sun May 12, 2013 7:38 am
--------------------------------------------------------------
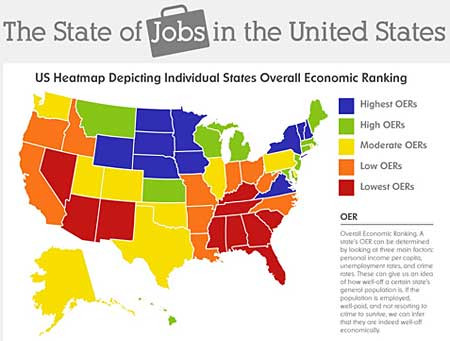
Number one AVOID THE GREED (RED = Most Greedy, Yellow = Average, Blue = Least Greedy):
Source: Kansas State University Department of Geography

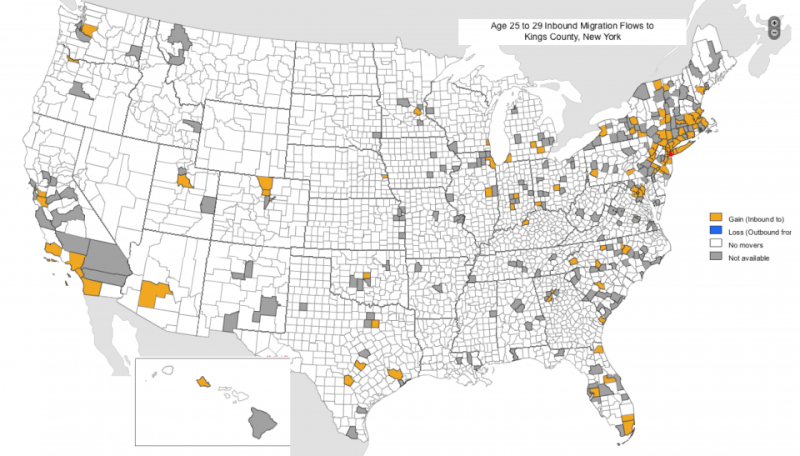
Where under 30's are moving. Rust: High inbound / Grey: No data / White: No movers
Link: top cities for Entrepreneurs: http://under30ceo.com/top-30-best-cities-for-young-entrepreneurs-2013
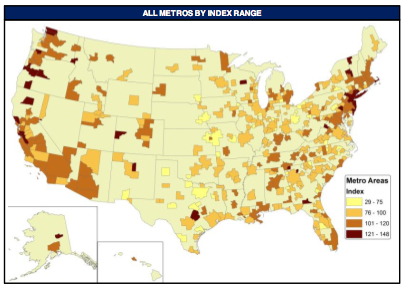
Metro Areas with a vibrant "Buy Local" Indie Scene - Darker = More "Buy Local" Indie
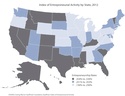
Entrepreneurship of states - dark states = better
How well a state is run
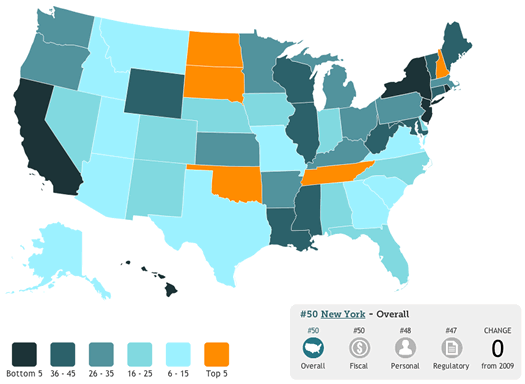
States with the most freedom both personal and economic
You can customize this map for personal, regulatory and fiscal ranking:
http://freedominthe50states.org/#personalize
Financial health of states (corresponds to how well state is run below)
Another states economic ranking map
How well does government run your state? (Green Best, Blue WORST)
Click map to enlarge (Ignore Ad's)

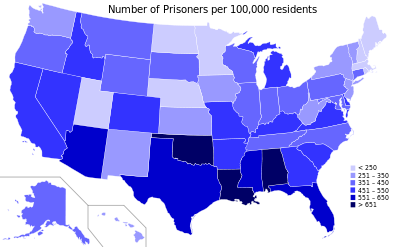
States with the most people in prison - hint: the darker the blue the more of a police state
Environment and climate change
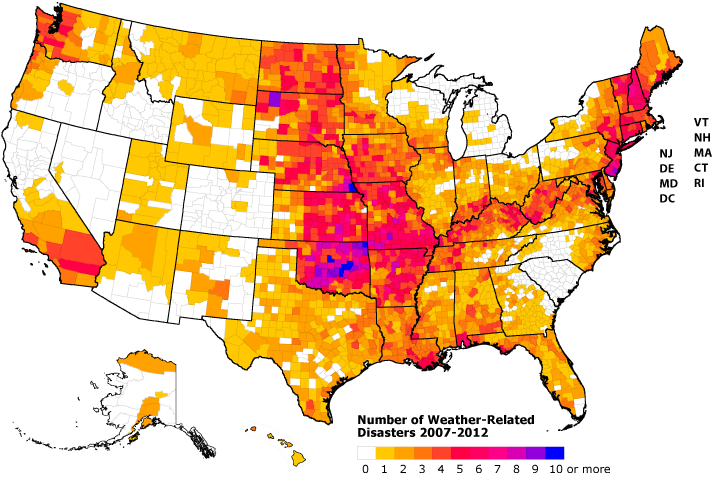
Disasters By County 2007-2012
Natural disasters map

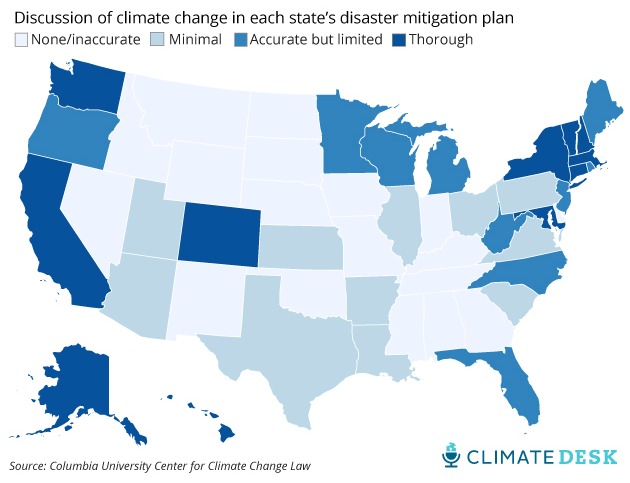
How well is your state prepared for climate change disasters? Darker = Better Prepared
where are the hipsters moving?
Resiliency of Regions in the USA Link to Berkeley Article: http://brr.berkeley.edu/rci/data/map
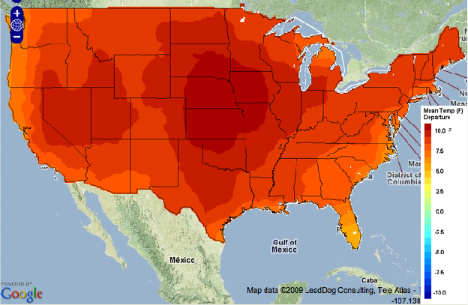
Temperature rise by 2050
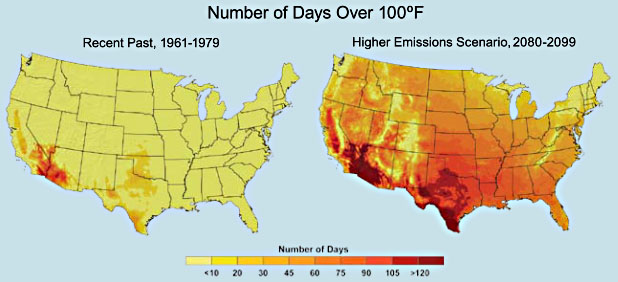
Map of days over 100 F past and future. Appalachia & Pac NW looks good
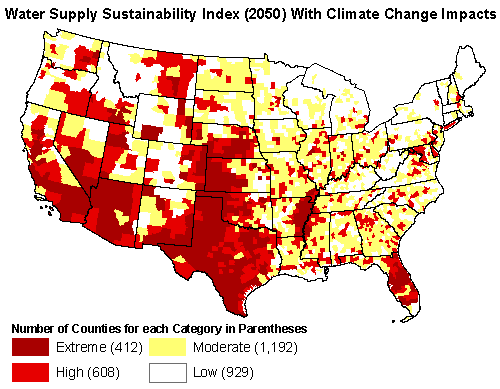
Water supply by 2050 - Droughts
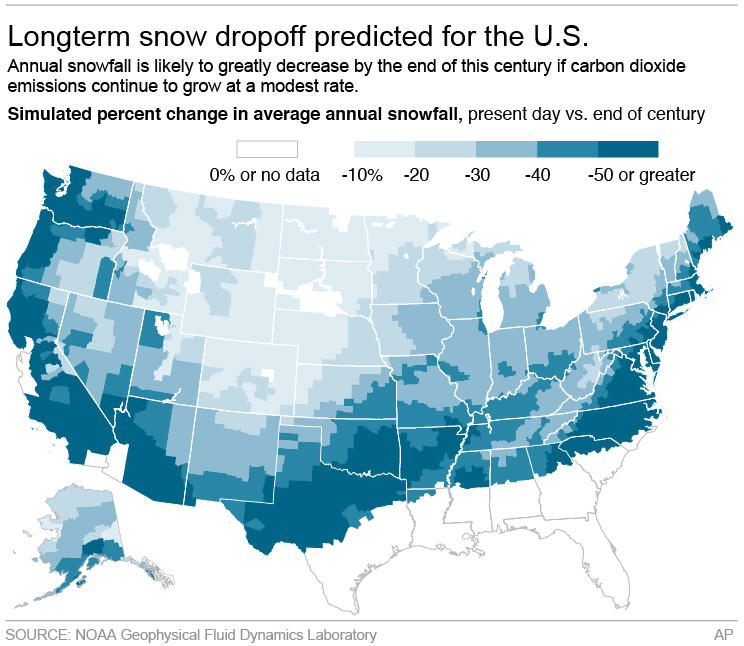
Decreasing overall snowfall in dark areas, but larger single event "Mega-Blizzards" especially in the Northeast
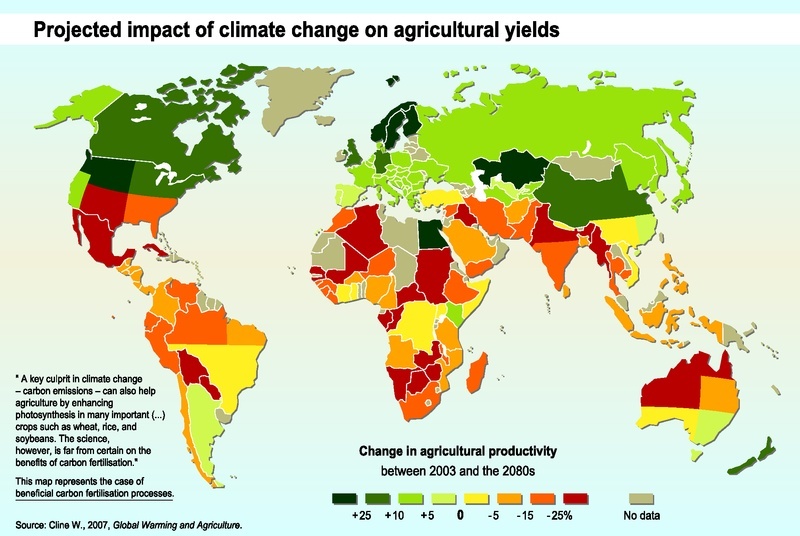
Projected impact of climate change on agriculture. Hint: Green is where the food will be
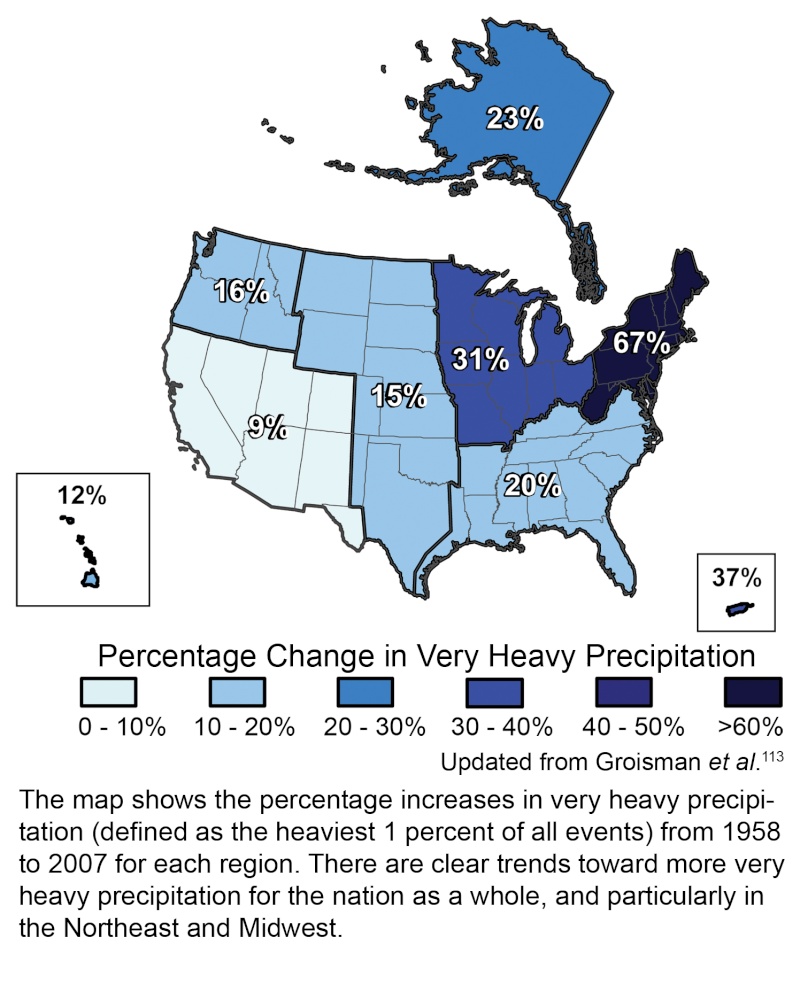
Increase in heavy precipitation (single event heavy snowfall and flooding events like sandy) despite an overall decrease in precip.
Air Quality Index by county (Red Worst, Green BEST)
Click Map To Enlarge (Ignore Ad's)
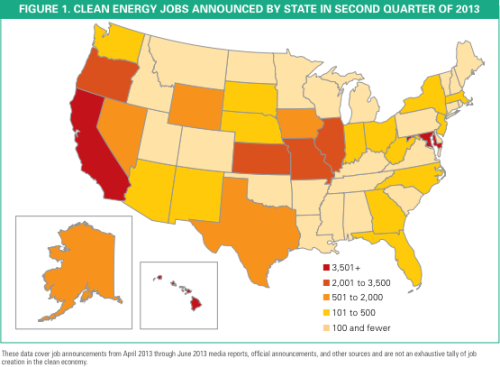
Creation of Green Energy Jobs 2013 - Also Indicates Energy Independence
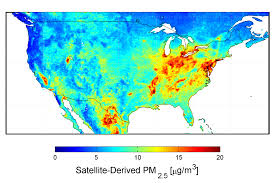
NASA Particulate Matter Map from coal fired plants! Brown: Worst Dark / Blue: Best
Unemployment and economy
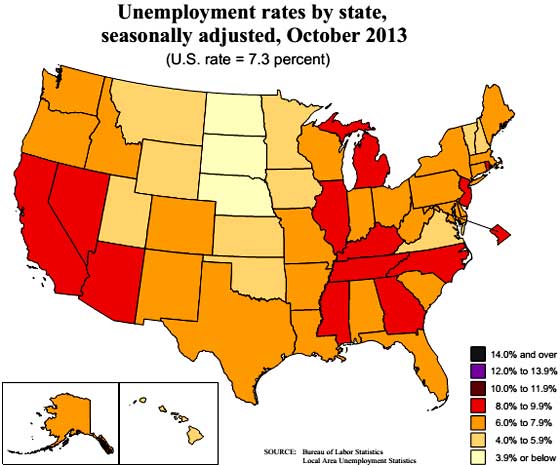
Unemployment by state October 2013
Unemployment by major metropolitan area - Red Worse, Yellow Better
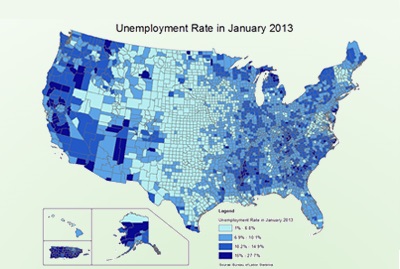
Unemployment by county 2013 (darker= higher unemployment)
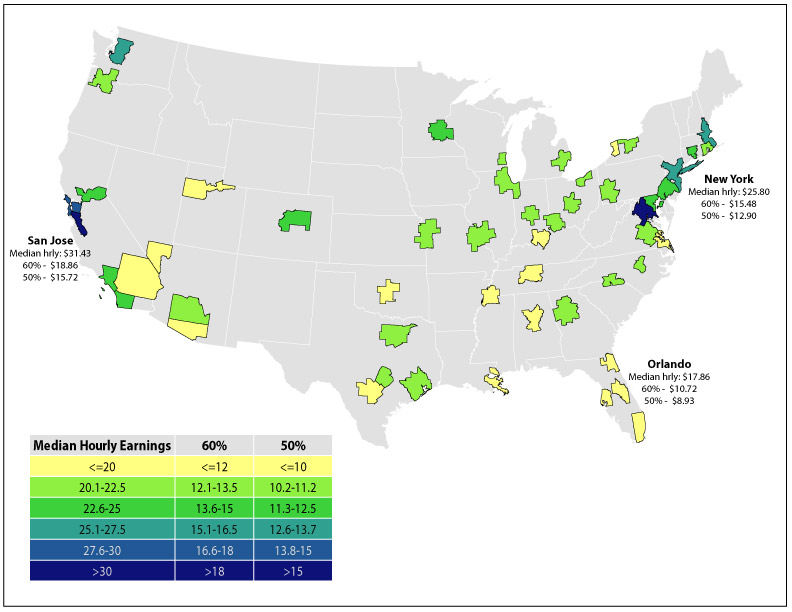
The map below shows how the median wage differs across America's largest metros. The metros highlighted in yellow are those where median full-time wages are less than $20 an hour. The metros marked in green are those where 50 percent of the metropolitan median is a figure between $10.20 and $12.50. The metros marked in teal and blue are those with the highest median wages.
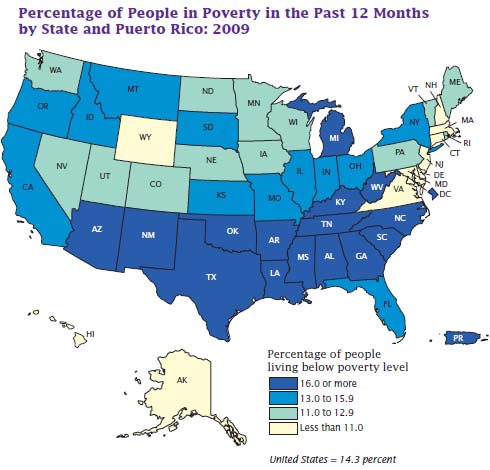
Persons living in poverty by state
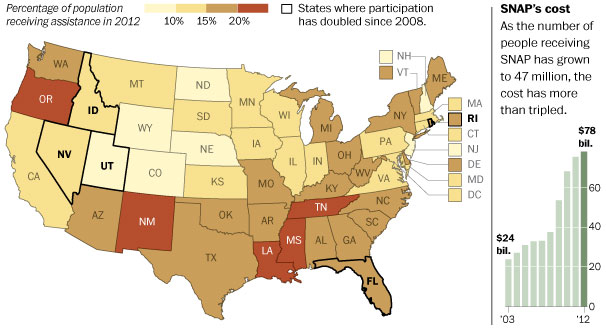
States with the most persons on Foodstamps (SNAP/EBT) 2012
States with the most uninsured
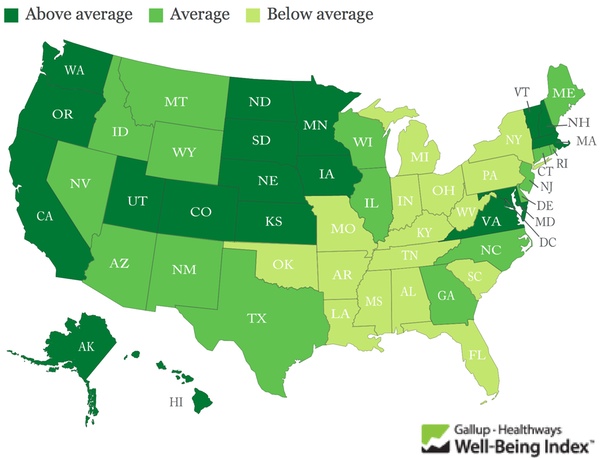
Health and well being by state
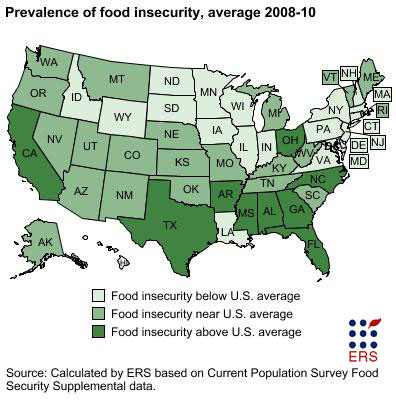
Food Security 2008-2010: States with more people going hungry (darker states)
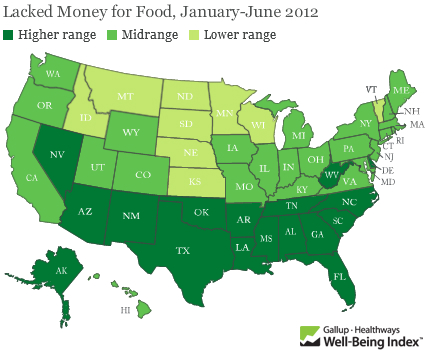
Food Security 2012 Notice the change from 2010!
Personal choices
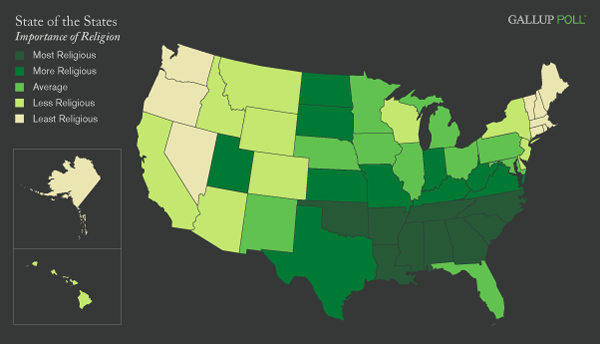
Religiousness of states (Religion= CONTROL)
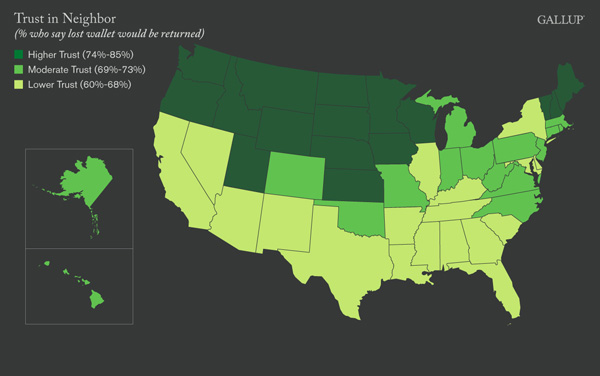
States where people are most likely to trust others
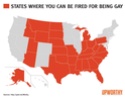
States you can be fired for being gay
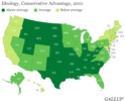
Conservative Leaning States - Dark Green (click on map to enlarge)
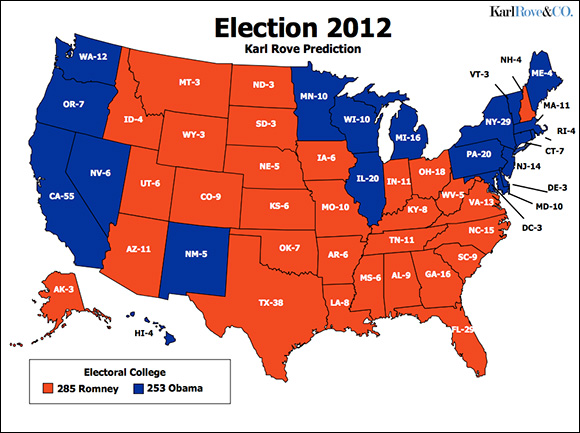
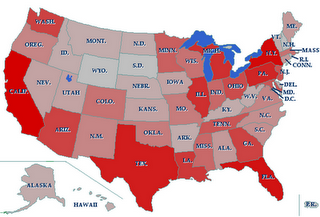
Red vs Blue states
Wages and Cost of Living
Cost of living by state
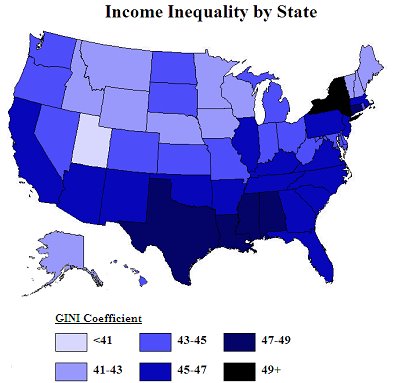
Gini Coefficient - Income distribution. the higher number the less income distribution and the more people in poverty. Link to article: http://mapscroll.blogspot.com/2009/04/is-us-becoming-third-world-country.html
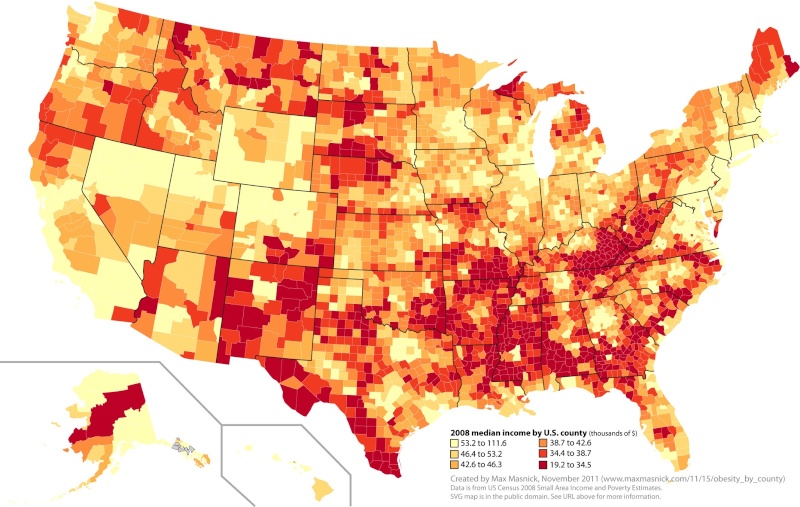
Income by county:
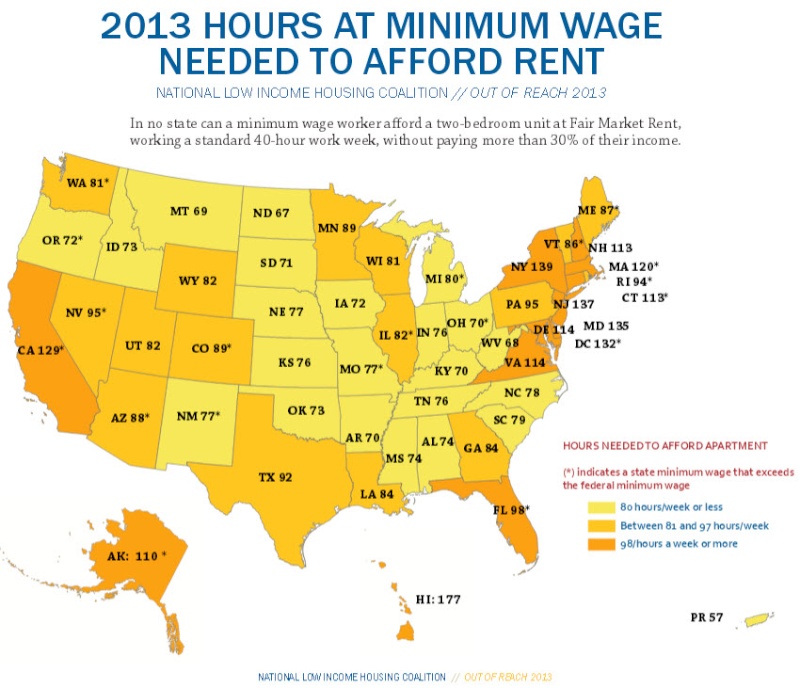
Hours at minimum wage needed to afford a 2 Br apartment:
Average weekly wages by state:
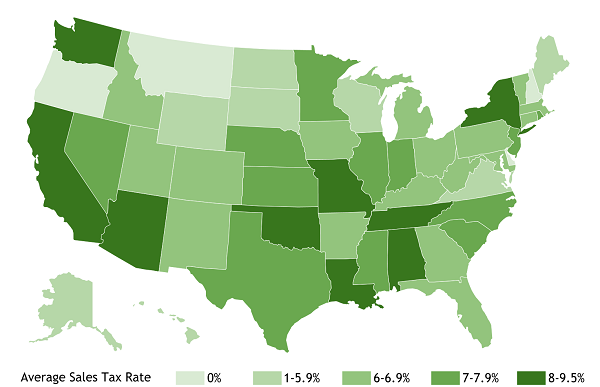
High sales tax rate - taking more of what you earn
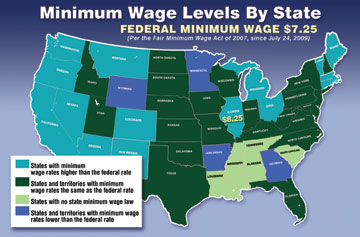
Minimum wage by state
Ability to protect ones self
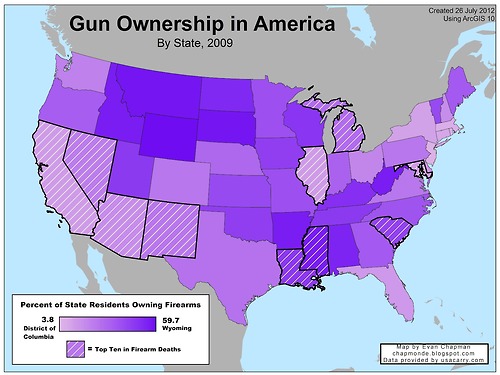
Gun ownership in the USA
States with constitutions protecting your right to bear arms. CA, NY & NJ have no constitutional provisions protecting your RIGHTS: http://www.trolp.org/main_pgs/issues/v11n1/Volokh.pdf
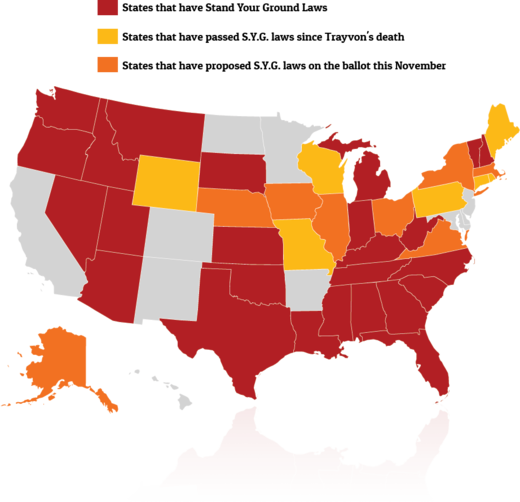
States with Stand Your Ground self-defense Laws
Police Brutality Map - Darker Red More Brutality
LINKS:
States where the police are heavy handed:
http://www.motorists.org/press/watch-your-wallet-in-these-10-states
Surveys

- Join date : 1969-12-31
» Choosing a State - Most Important Factors
» The Only Factor To Consider When Choosing a State - Making Money
» Maps, Charts and Statistics 2
» Local Food and Growing Maps
» Best State To Live In - Climate Change
» The Only Factor To Consider When Choosing a State - Making Money
» Maps, Charts and Statistics 2
» Local Food and Growing Maps
» Best State To Live In - Climate Change
Page 1 of 1
Permissions in this forum:
You cannot reply to topics in this forum|
|
|
